About midsona
Divisions
Our divisions

Nordics
Sweden, Denmark, Norway, Finland
2,324 MSEK net sales in 2025

North Europe
Germany
934 MSEK net sales in 2025

South Europe
France and Spain
402 MSEK net sales in 2025
Division facts

Division Nordics
64% of total sales in 2025


Markets
Sweden, Denmark, Norway, Finland
Key figures - Q1 2026
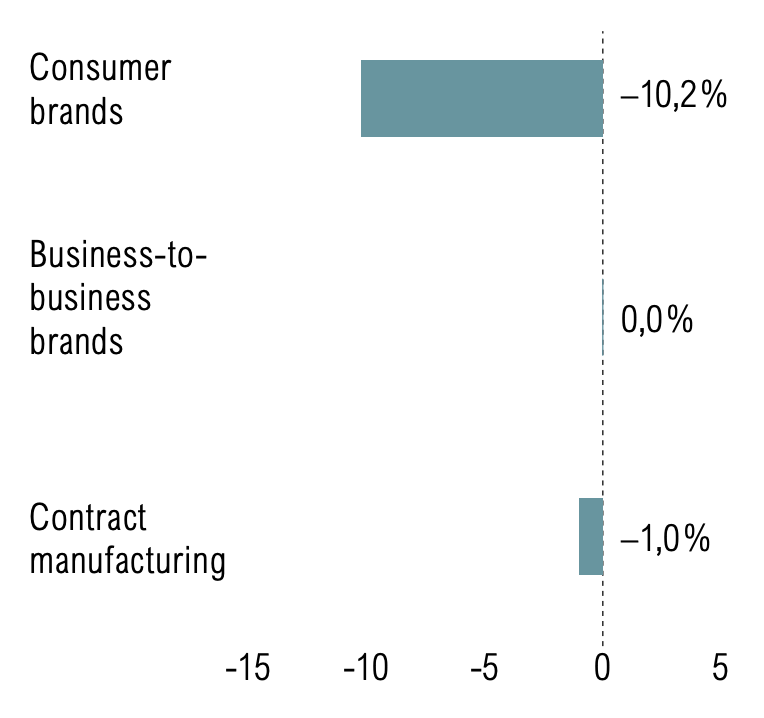
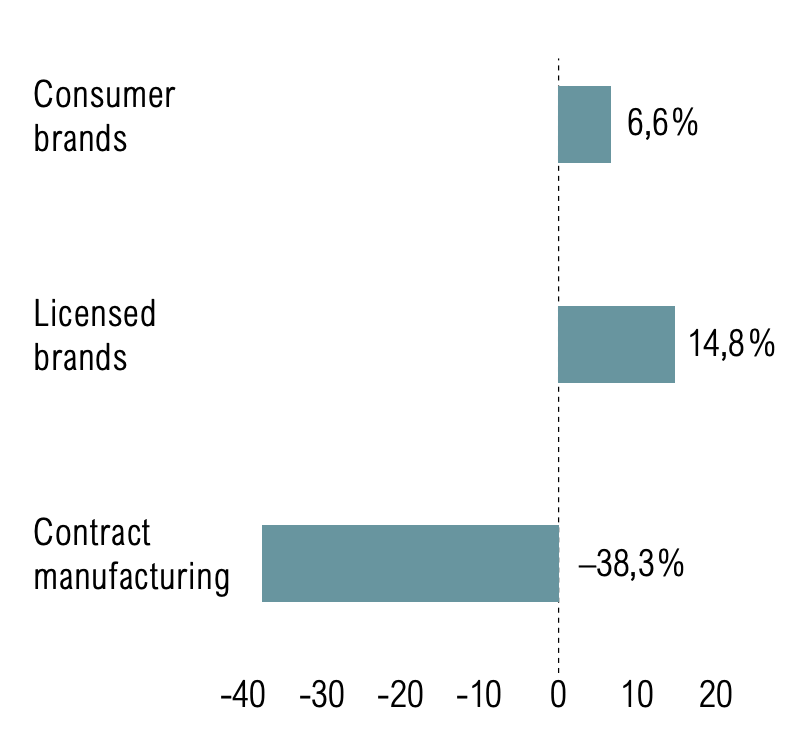
Organic growth of types of brands

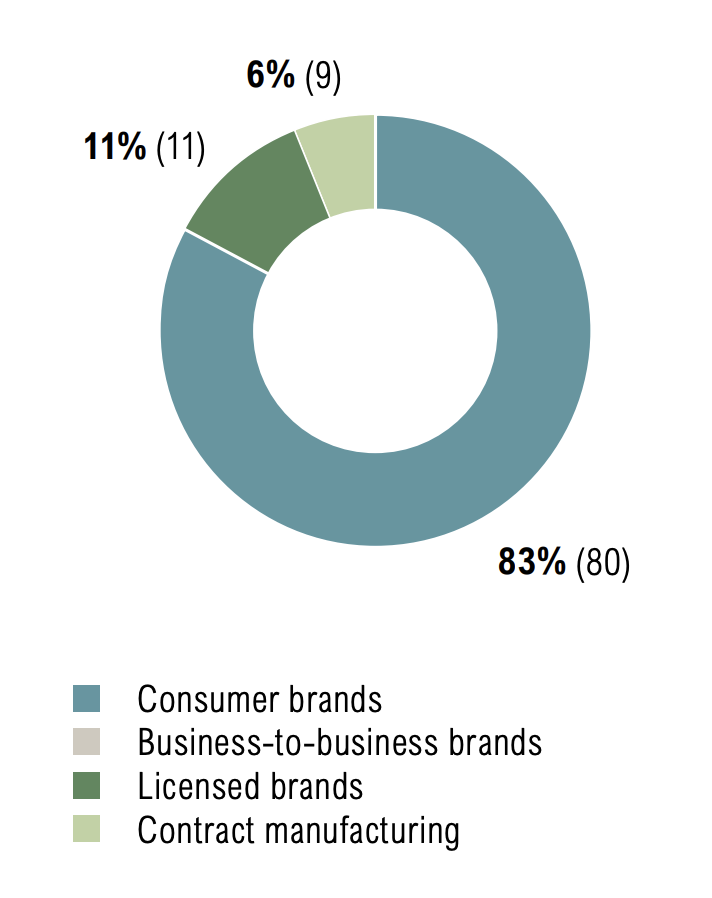
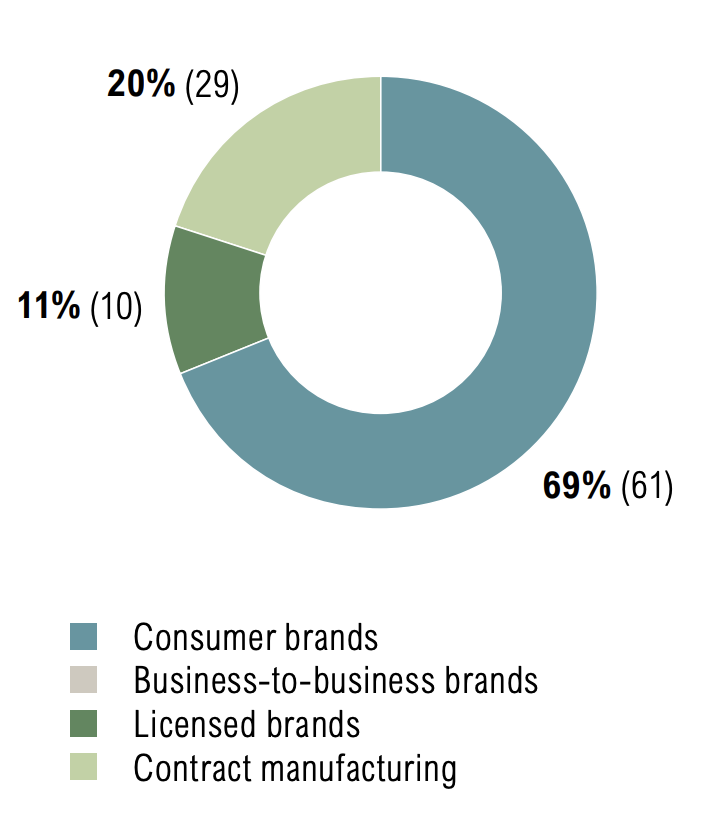
Product sales by type of brand
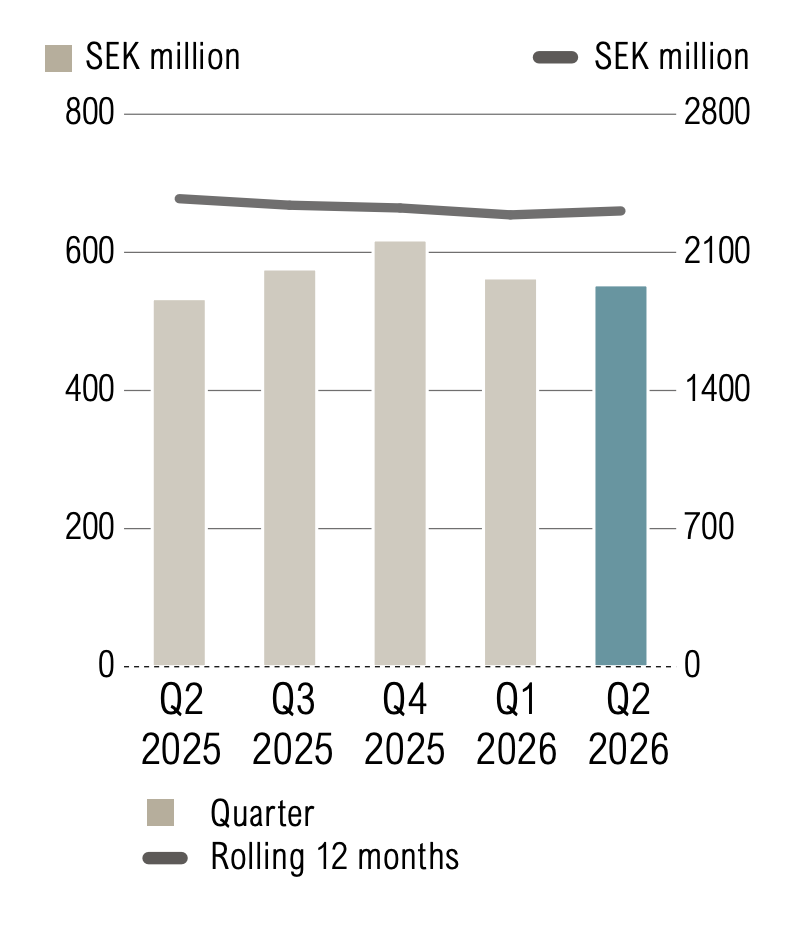
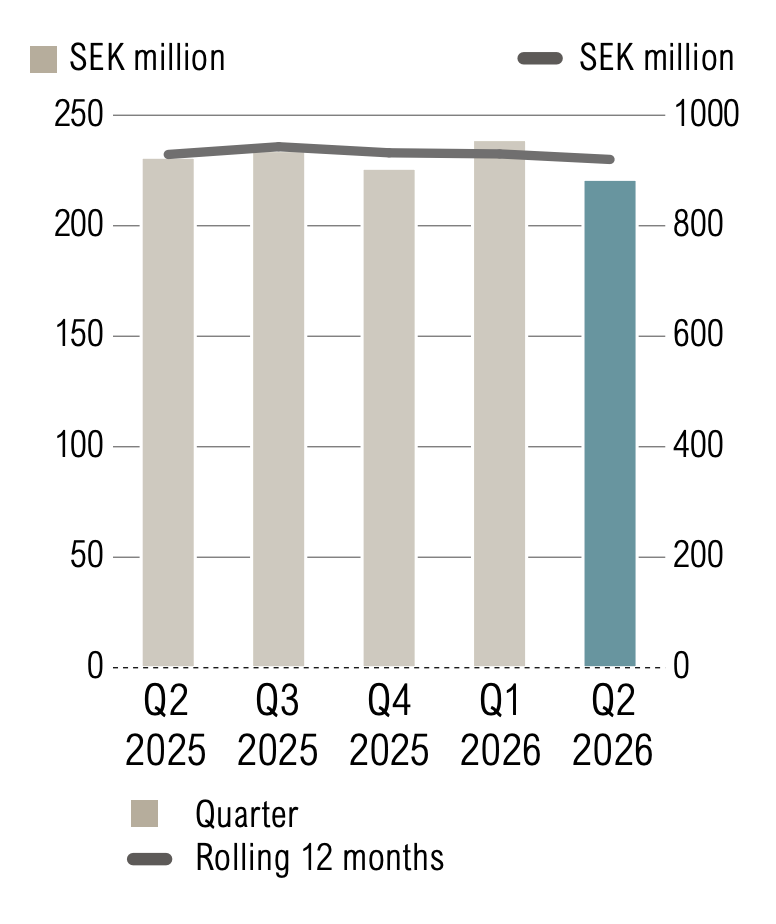
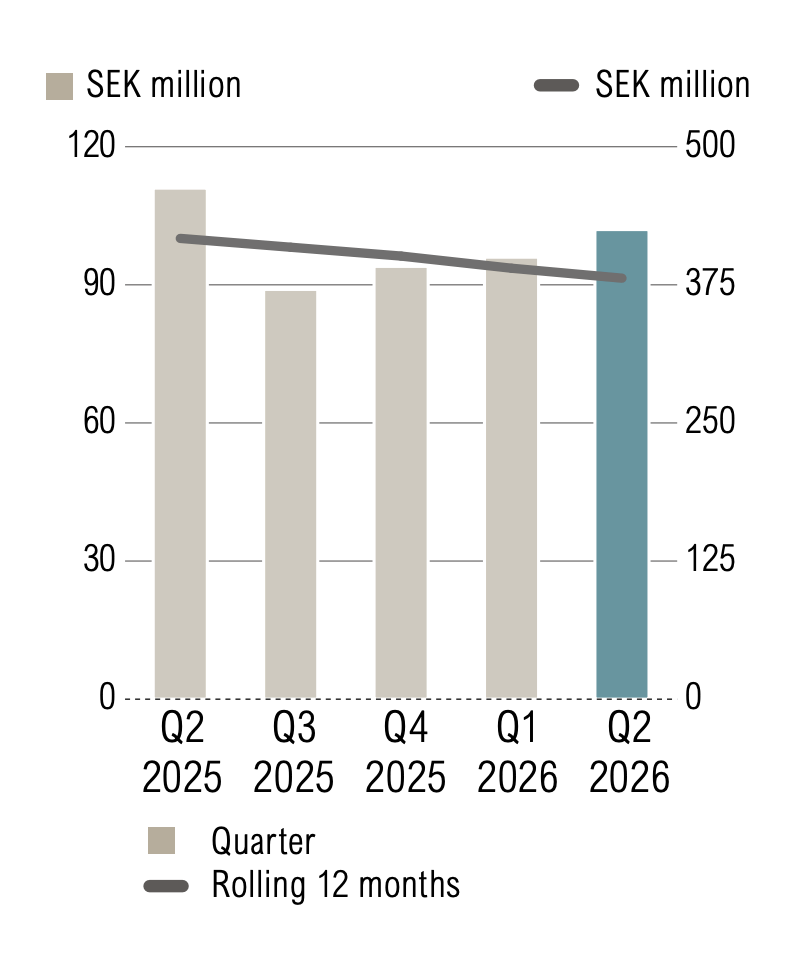
Net sales
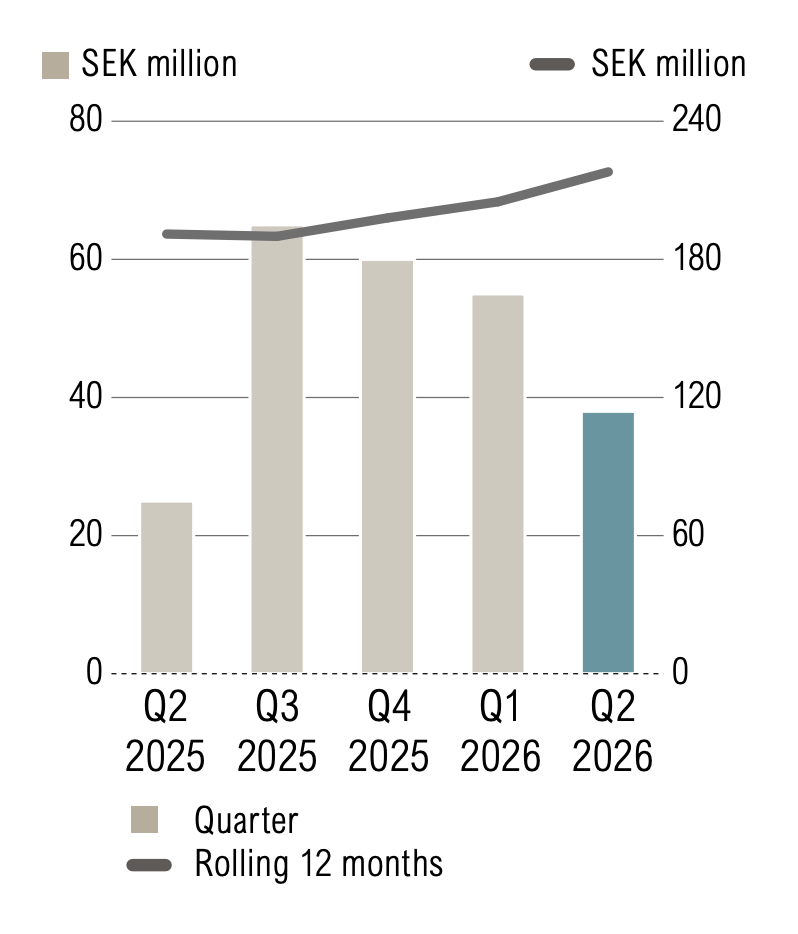
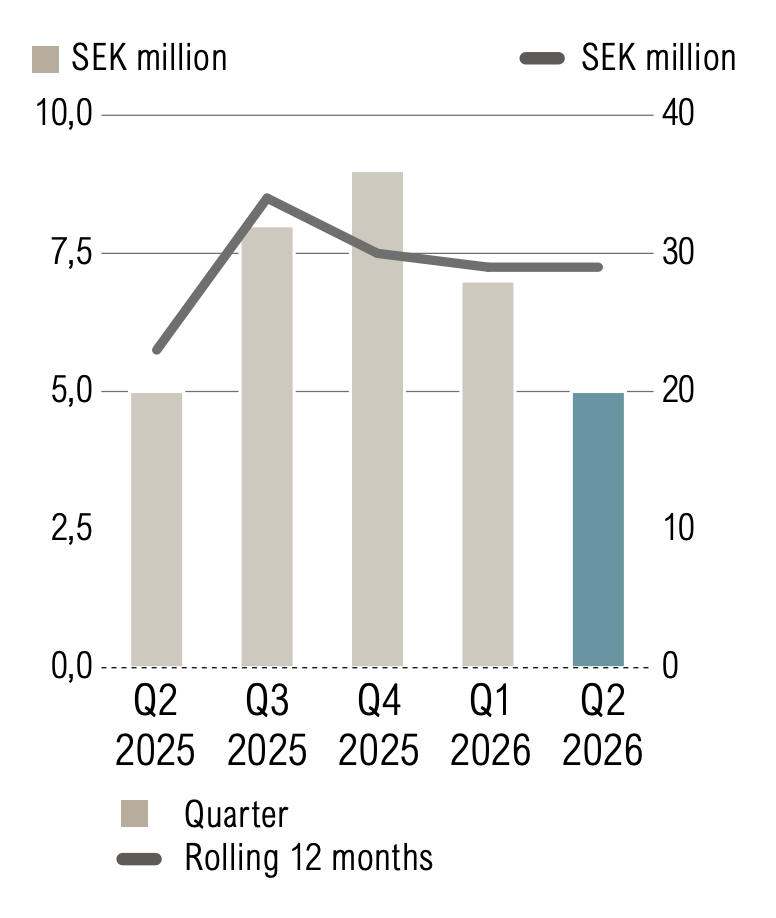
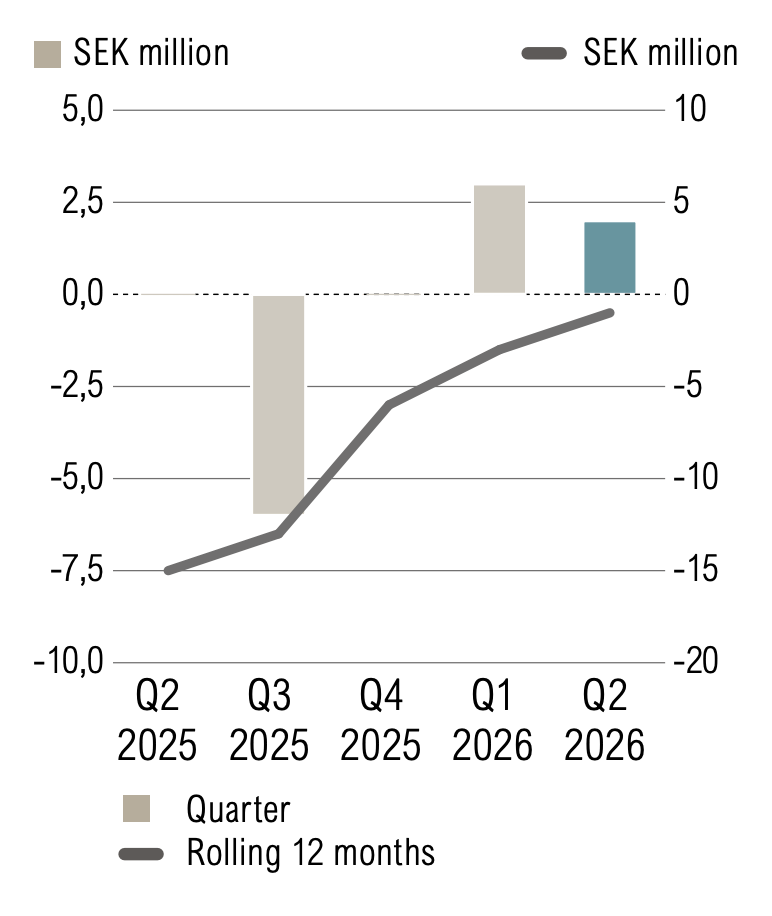
Operating profit/loss, before items affecting comparability

Division North Europe
25% of total sales in 2025

Brands
Markets
Germany
Key figures - Q1 2026
Organic growth of types of brands
Product sales by type of brand

Net sales
Operating profit/loss, before items affecting comparability

Get regular updates about Midsona
Subscribe to get notifications when we release new press releases.